Use Cases
If you are building AI characters or experiences with Convai, you might have wanted to track how many sessions your character was involved in or how many end users it interacted with. You likely want to understand all of this—and more—fast!
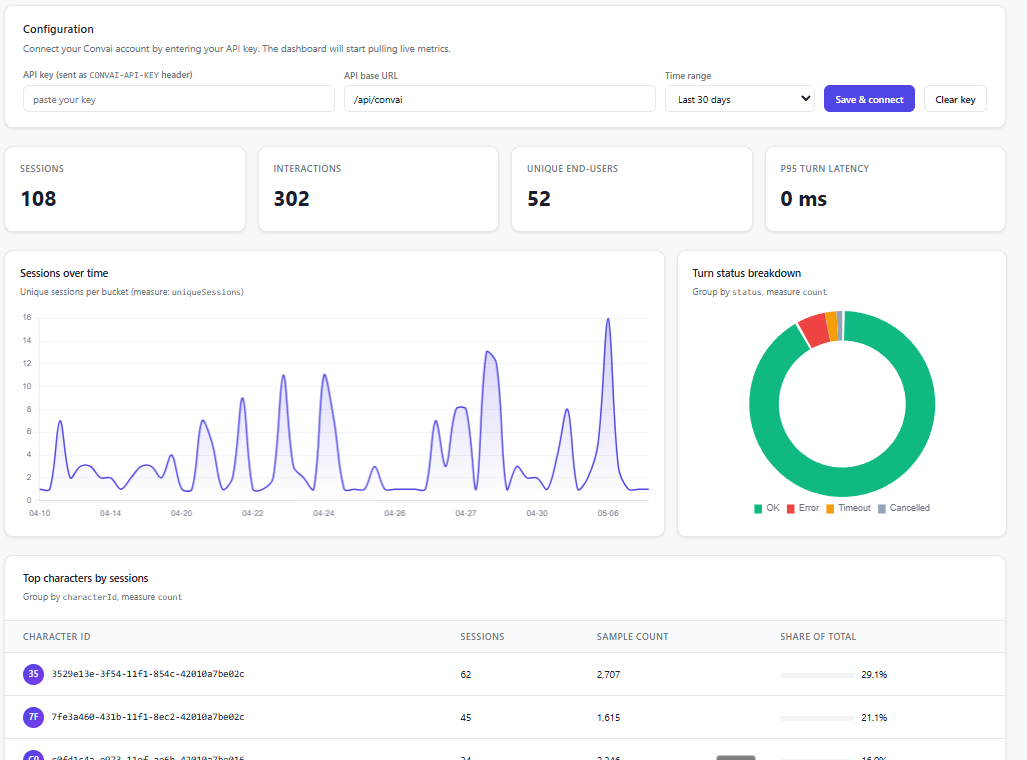
The usual path is loading a dashboard, picking a date range, selecting a character, comparing charts. It works. But it is slow, it is manual, and there is no way to hand it to an AI agent to investigate on your behalf.
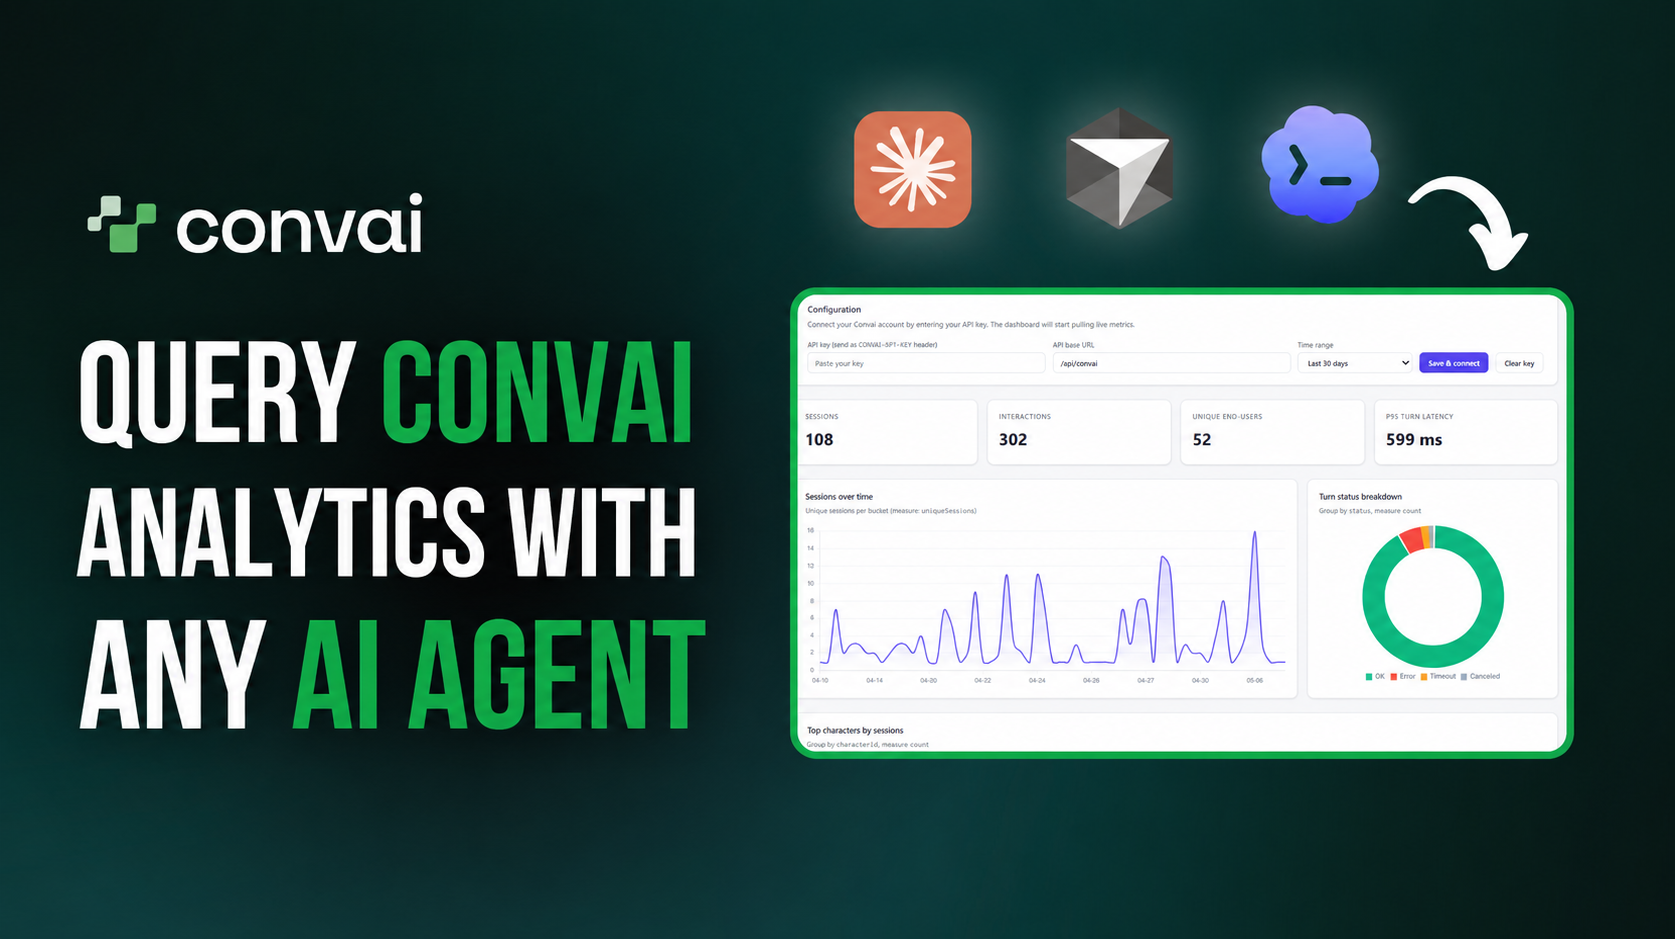
That changes today. Convai's Analytics MCP server is live: an open-source, agent-friendly interface that lets you and your AI tools query Convai session telemetry in plain English using only your Convai API key.
Watch the full video below to learn more:
The Convai Analytics MCP is a Model Context Protocol server built on top of Convai's analytics APIs. It exposes typed analytics tools that any MCP-compatible client can call.
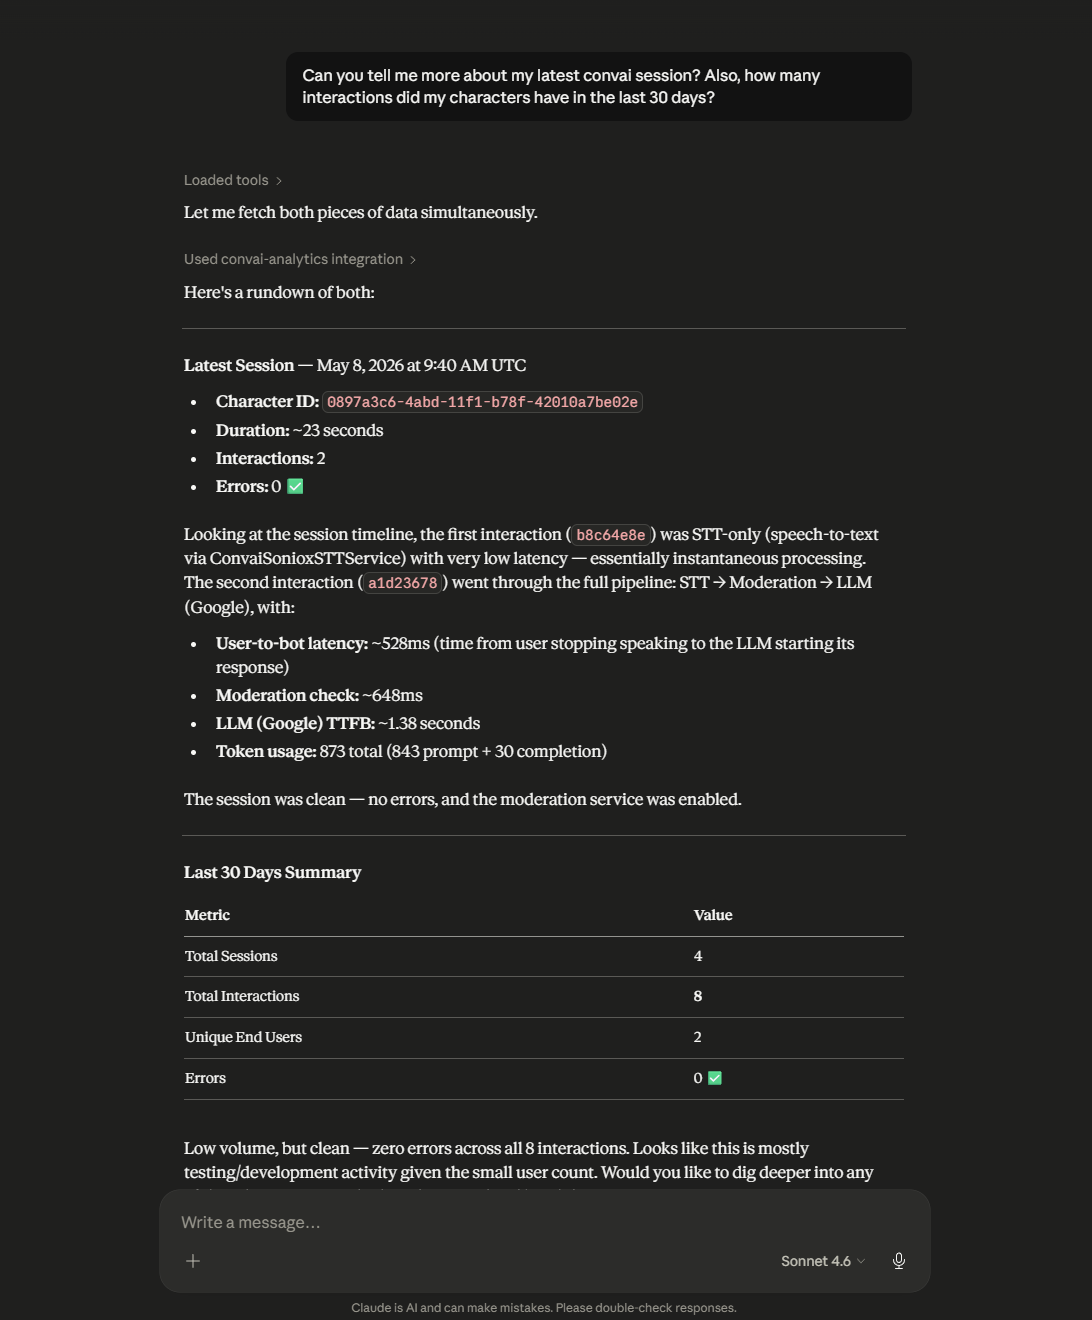
Connect it to Claude Desktop, Cursor, or any STDIO MCP host and ask:
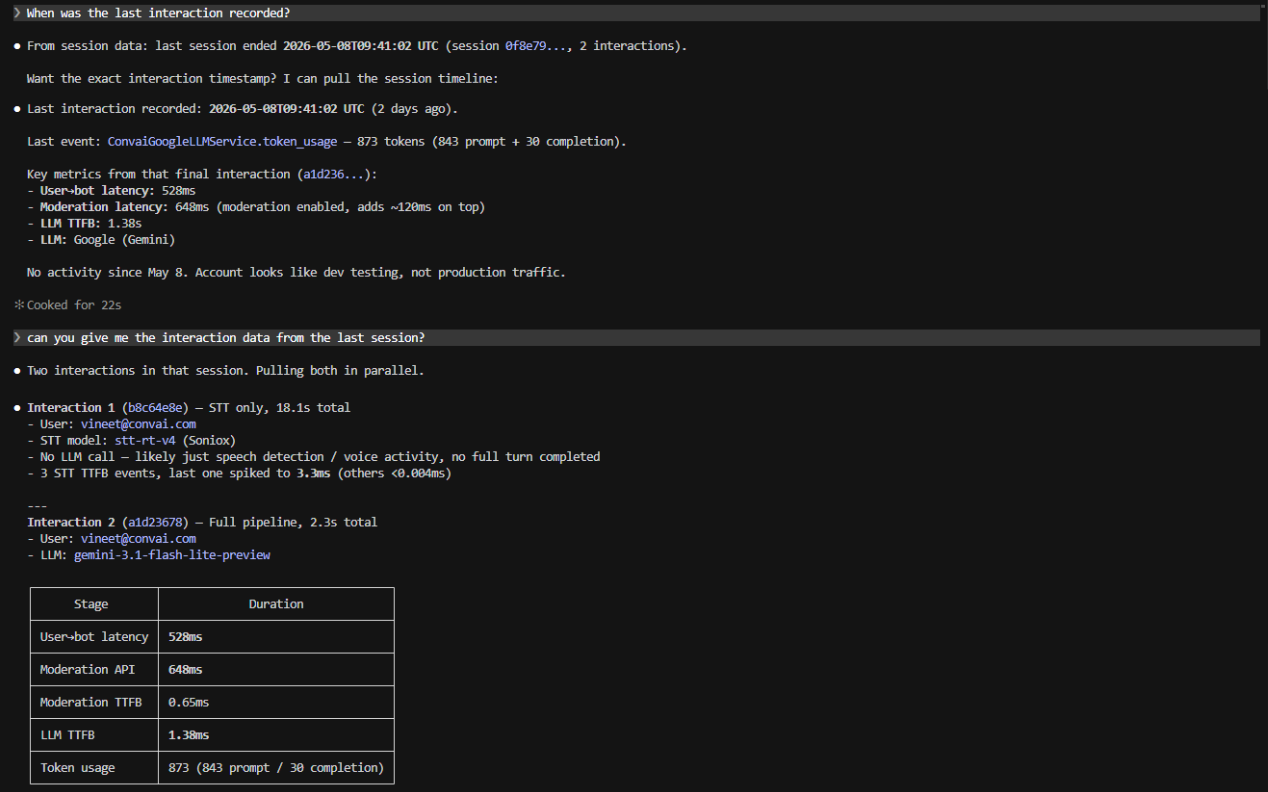
You get structured, queryable answers. Not a link to a chart.
The server is read-only. It wraps the public Convai Analytics API at https://analytics-api.convai.com/v1/analytics using your CONVAI_API_KEY. It does not accept account overrides or service credentials, and account scoping is enforced server-side. Your data stays yours.
Also read: Convai Core AI Settings: Choose Your LLM, Temperature, and Moderation
Beyond answering one-off questions, the Analytics MCP is a tool layer that agentic workflows can use programmatically.
One internal user connected it to Claude Code with a simple prompt — "I want a dashboard" — and the agent used the MCP tools to query the data and scaffold a full React and Vite analytics UI. The MCP gave the agent the data. The agent did the rest.
That is the pattern: give an AI agent access to your Convai telemetry as a structured tool layer, and it can investigate, summarize, visualize, and alert without any custom integration code on your end.
export CONVAI_API_KEY="your_convai_api_key"$env:CONVAI_API_KEY="your_convai_api_key"Get your API key from your Convai account dashboard. This is a bearer secret — keep it in environment variables or a secrets manager, never in client-side code.
npx -y @convai/analytics-mcp@latestThe server starts and listens for connections from your MCP client via STDIO. Running @latest ensures you always get the current stable release (currently 0.2.4).
Add the following to your Claude Desktop MCP configuration file:
macOS: ~/Library/Application Support/Claude/claude_desktop_config.json
Windows: %APPDATA%\Claude\claude_desktop_config.json
{
  "mcpServers": {
    "convai-analytics": {
      "command": "npx",
      "args": ["-y", "@convai/analytics-mcp@latest"],
      "env": {
        "CONVAI_API_KEY": "your_convai_api_key"
      }
    }
  }
}
Restart Claude Desktop after saving. The Convai Analytics tools will appear in the tools panel.
In Cursor Settings → MCP, or in .cursor/mcp.json at the root of your project:
{
  "mcpServers": {
    "convai-analytics": {
      "command": "npx",
      "args": ["-y", "@convai/analytics-mcp@latest"],
      "env": {
        "CONVAI_API_KEY": "your_convai_api_key"
      }
    }
  }
}
Any STDIO MCP host follows the same pattern: command is npx, args are ["-y", "@convai/analytics-mcp@latest"], and the API key goes in the env block.
For programmatic access outside of an MCP client, the TypeScript SDK gives you direct API access:
npm install @convai/analyticsimport { ConvaiAnalytics } from "@convai/analytics";
const client = new ConvaiAnalytics({ apiKey: process.env.CONVAI_API_KEY });
const summary = await client.summary({ range: "last_7d" });
console.log(summary);A CLI package is also available for scripted queries and pipelines:
npm install -g @convai/analytics-cliAll three packages — @convai/analytics, @convai/analytics-mcp, and @convai/analytics-cli — are published under the @convai scope on npm and versioned together. Current stable: 0.2.4.
Repo (open source): github.com/Conv-AI/convai-analytics
npm package: @convai/analytics-mcp
MCP Registry: registry.modelcontextprotocol.io
Your Convai API key is all you need. Export it, run the npx command, connect your client, and start asking questions about your data.

Now that you know how you can easily query your Convai analytics data via AI Agents, it's time to start building your own interactive Convai Analytics dashboards!
Drop questions and feedback in the Convai Developer Forum.
Also read: How to Use Mindview to Debug Your Convai Character's LLM Prompt
The Convai Analytics MCP is an open-source Model Context Protocol server that gives developers and AI agents programmatic access to Convai session telemetry. Connect it to Claude Desktop, Cursor, or any STDIO MCP host and query usage, latency, error rates, and interaction traces in plain English using only your Convai API key.
Export your Convai API key with export CONVAI_API_KEY=your_key and run npx -y @convai/analytics-mcp@latest. Then add the server to your MCP client config JSON. Full config snippets for Claude Desktop and Cursor are in the blog above.
Session engagement, latency percentiles (P50/P95/P99), component bottlenecks, error rates, provider and model comparisons, regression detection, and interaction-level waterfall traces. You can also ask a coding agent like Claude Code or Cursor to build a full analytics dashboard using the MCP tools.
Yes. Add it to your Claude Desktop MCP config JSON under mcpServers with command npx and args ["-y", "@convai/analytics-mcp@latest"], and set CONVAI_API_KEY in the env block. It also works with Cursor, Codex-compatible clients, and any STDIO MCP host.
Yes. The MCP server wraps the public Convai Analytics API and is strictly read-only. It does not modify characters, sessions, or configurations. Account scoping is enforced server-side using your API key.


